Part Three: d3.js
Before I start I want to give a big shout out to Ben (@benjaminbenben) who was helping me with some performance stuff I having trouble with. In doing so he really opened my eyes to how powerful d3 is and actually how suited a library it is to help with what we are doing here.
It’s dubbed a ‘visualisation library’, however I think it’s relationship with data has given it a reputation that makes people who haven't discovered it, assume it’s just for pie charts. That’s changing now, and don’t get me wrong it’s good for displaying data, but that’s just it it’s good with displaying and it’s good with data. So anything you want to do with the DOM or anything you want to do with data and d3 has you covered.
I’ve noticed a lot of the things I’m building use a great deal of DOM manipulation and data manipulation, so it felt like a great thing to start playing with. It’s also worth noting here I’m using version 3, version 4 was recently released with a great deal of updates and changes, but as I’m learning and pretty much all the tutorials still use version 3, I’m going to stick with that. When I’m more comfortable with the library I can start to look at the update documentation.
Just have a glance down the API reference and we can see some totally useful data functions, array methods, thing’s for colour, layout, timing… well loads of stuff which is great for what I’m doing here. Not just with creating, but keeping and manipulating, which is easier than me writing it all out manually, and will be much better performance wise as well.
Ok, ok, enough evangelising. Let’s get using.
We need data to get d3 to really do anything, but we have that, we have this array of velocity values from our frequency; frequencyData. We can get d3 to create an element for each item in the array, attach the relative data to each element and then start to use it to manipulate the DOM element, whether that be change it’s size, position, colour of whatever.
Number Thirteen: Super Chart
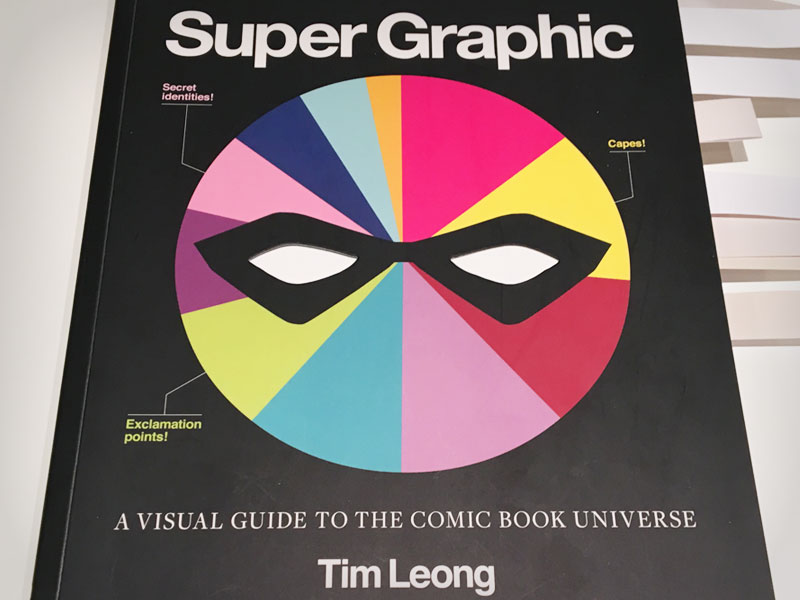
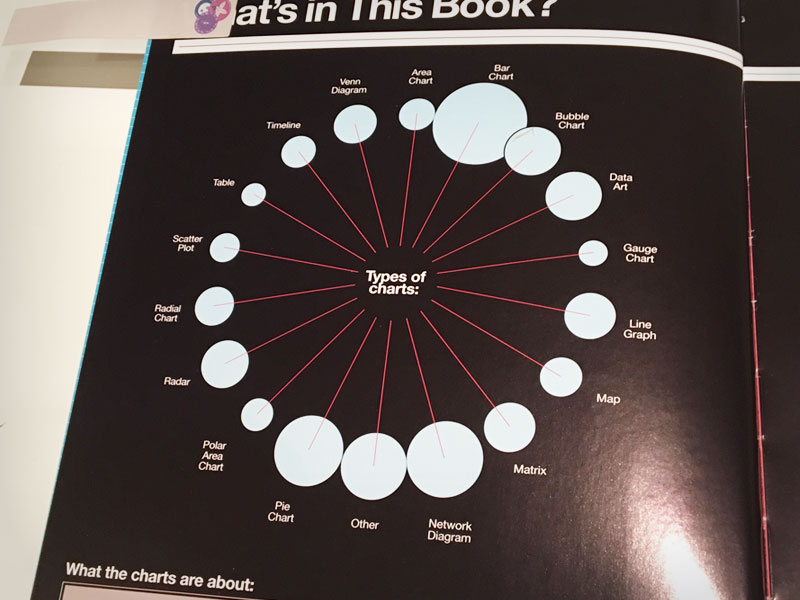
My inspiration for this series is from the book Super Graphic by Tim Leong. It's a bunch of data visualisations from and about comic books. Check it out it's pretty sweet. Perfect for inspiration for audio vis!
So let’s start with this example:
At the moment we have 256 items in our frequency array, piping that into d3 would mean it would create 256 elements, one for each frequency (unless we did some array manipulation, but for simplicities sake, let’s just reduce the number of elements).
So let’s change it to less: frequencyData = new Uint8Array(16); Remembering to change our fft size as well as we don't need it to be as big: analyserNode.fftSize = 32;
Now all we need is a little d3 “enter and exit” pattern. This is where we take the data and create a new element for each item, bind the data item to said element and add some params using said data.
// enter and exit
var svg = d3.select('svg');
var circle = svg.selectAll('circle'),
  radius = window.innerHeight/2.5-50;

function drawCircles() {

  requestAnimationFrame(drawCircles);
  analyserNode.getByteFrequencyData(frequencyData);

  circle = circle.data(frequencyData);

  circle
    .enter().append('circle')
    .attr("cy", function(d, i) {
      return Math.round(window.innerHeight/2 + (radius*Math.sin((2*i*Math.PI)/16)) );
    })
    .attr("cx", function(d, i) {
      return Math.round(window.innerWidth/2 + (radius*Math.cos((2*i*Math.PI)/16)) );
    });

  circle
    .attr("r", function(d) { return d/2; })
    .attr("fill", "hsla(200,50%,80%,0.7)")
    .exit().remove();
}
Here we’re creating a circle for each item in the frequencyData array, then positioning them in a circle with a bit of maths. The params d and i being passed into the function are the data itself and the item number. So further below when we set the radius of the circle we can use the data, which as we know is the frequency velocity.
This all seems a little more succinct than how we were going about it before. In the final example I’m also creating a line, just to add a bit more 🤗
See the Pen Codevember AudioVis #13 by Rumyra (@Rumyra) on CodePen.
You can already see the difference in performance compared to previous days. I’m from the "apprehensive to use a library unless I need/know etc…"" camp of JS, but in this instance it’s really helping. Most of the rest of the example are probably going to incorporate it I can imagine. So as we go through the next few days we can see what else d3 has to offer.
Number Fourteen: Super Colours
What can I say - this one is probably the most me so far!
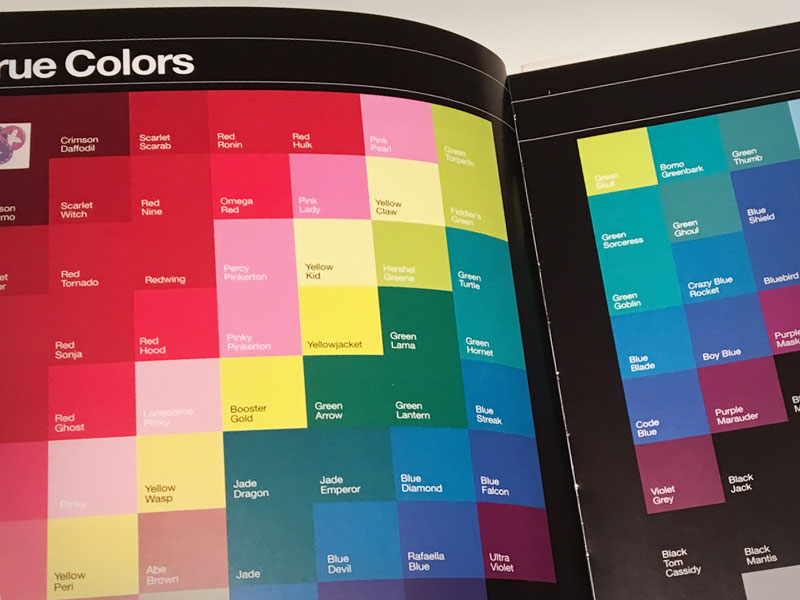
The technique is much the same as the previous example, just this time we’re creating SVG rect elements and doing some maths to position and colour them. The data is being used to adjust the brightness of the squares, although we could use it for anything. Another good example that would be good to live code at a gig.