Welcome to my Codevember. This month I’m going to take you through some audio visualisation techniques in the browser. I’ve written and spoken about this a number of times, as well as made a few codepens every now and again, but I thought I would take this month to go over creating audio triggered visuals from the ground up.
Not only do I hope this be a learning journey for you, but one for me as well, there’s been a number of different techniques, new web features, libraries etc… that I’ve wanted to try, it seems like Codevember is the perfect opportunity.
See the Pen Codevember AudioVis #1 by Rumyra (@Rumyra) on CodePen.
We’re going to start vanilla, from the very basics, just using the very minimal we can from the web audio API and some DOM elements, then slowly I’ll start trying some different techniques. By the end we would have covered audio analysing, new css techniques, d3.js which I find is so suited to audio-vis, bringing in some svgs and hopefully some canvas too.
And along with each technique I’ll be taking influence from somewhere different, be that an artist, a book from the stepshelf or some tumblr somewhere.
By the end of the month you’ll understand why audio vis has excited me for all these years, and why the browser can be such an incredible environment for this creativity.
A couple of things to note:
- This is a learning experience for me too, so things may stay quite basic. The code will probably be basic, however this does mean it won’t be too complicated for entry level coders.
- I’ll be analysing audio from the microphone, which means I’ll be using the Media Streams API, which only works over https, you’ll need to view the pens over https://codepen.io
- Things work best in Canary so I’ve noticed, please don’t expect pens to work cross browser. The main end game for me is to integrate them into my VJ software, which I run in a sandboxed environment (my machine, my choice of browser) sux I know!
- I’ll be cross posting all these articles to both my Codepen Blog and my personal blog.
- There's a high chance I won't make every single day, but I will try 🙃
So Let’s Begin
Basic audio analysis and DOM manipulation
Let’s start with the audio things we’re going to need. The audio API can be a bit over whelming. There’s a whole bunch of properties and methods you get when you create a new audio context. There’s inputs, filters, effects… but we can feel a bit better because we only need one piece of functionality - the analyser.
Setting up the audio API
Let’s start by creating a new audio context and initiating our variables.
// set up audio context
var audioContext = (window.AudioContext || window.webkitAudioContext);
// create audio class
if (audioContext) {
  // Web Audio API is available.
  var audioAPI = new audioContext();
  } else {
  // Web Audio API is not available. Ask the user to use a supported browser.
  alert("Oh nos! It appears your browser does not support the Web Audio API, please upgrade or use a different browser");
}

// variables
var analyserNode,
  frequencyData = new Uint8Array(256);
const screen = document.querySelector('#screen'),
  allRepeatedEls = document.querySelectorAll('#screen section'),
  totalEls = allRepeatedEls.length;
Here we’re checking the browser has the audio API available and instantiating a new context var audioAPI for use.
Then we’re just creating a few variables for use later on.
Now we need to hook into the functionality of the analyser node that comes with the audio API. The analyser node comes with methods for us to access both frequency and time data, for what we want we just need the getByteFrequencyData method which we will use later. But as that uses ‘fft’ data (fast fourier transform) we need to set up an array for that data to be saved into, and also set the size. This is where the frequencyData = new Uint8Array(256) comes into play above. A good way to view the size is it’s a bit like resolution - the bigger this array, the more intricate the data and thus the more information about the frequencies heard we can display. This is more than likely set to around 1024, however for the purposes of a simple visualisation like this first one I’m taking you through, 256 more than suffices.
So let’s create and connect our analyser node:
function createAnalyserNode(audioSource) {
  analyserNode = audioAPI.createAnalyser();
  analyserNode.fftSize = 512;
  audioSource.connect(analyserNode);
}
Note that the fftSize property has been set to twice the array size we set earlier. The in depth stuff behind fast Fourier transforms are slightly out of the remit of this article, but you can read more here.
Another thing to note is we connect the analyser node to the audio source, as all methods within the audio API are are viewed upon as nodes that you connect together. So you can connect inputs to filters to volume nodes to analysers etc…
Getting some sound
Now we want an input for the audio API to analyse, we can just grab the microphone input: (NB this API needs permissions and only works over https or on localhost… just change the codepen url to have https:// at the beginning).
// getUserMedia success callback -> pipe audio stream into audio API
var gotStream = function(stream) {
  // Create an audio input from the stream.
  var audioSource = audioAPI.createMediaStreamSource(stream);
  createAnalyserNode(audioSource);
  animateStuff();
}

navigator.mediaDevices.getUserMedia({ audio: true, video: false })
  .then(gotStream);
We’re calling the gotStream function when we receive an audio stream from the microphone, and within that we’re piping it into the audio API and calling the createAnalyserNode function from above.
So the audio API now is analysing the audio stream from the microphone and we can stop here. But, we kinda want to move something around the browser based on the data we receive.
Animating stuff
You may have noticed the gotStream function calling animateStuff() which we haven’t written yet. Now here’s the fun part.
function animateStuff() {
  requestAnimationFrame(animateStuff);
  analyserNode.getByteFrequencyData(frequencyData);
}
This is the start of our awesome animating function. We want it to keep running and analysing the sound, so we’ll use requestAnimationFrame for that. Then we call the getByteFrequencyData method on the analyser node we connected earlier and pass in our frequencyData array. This means at every item in our array represents a frequency and when called a volume level is being logged against that frequency.
The volume, (it’s actually amplitude, but, meh words), is just a number and we can use that number to change things, it’s updating all the time because of our requestAnimationFrame.
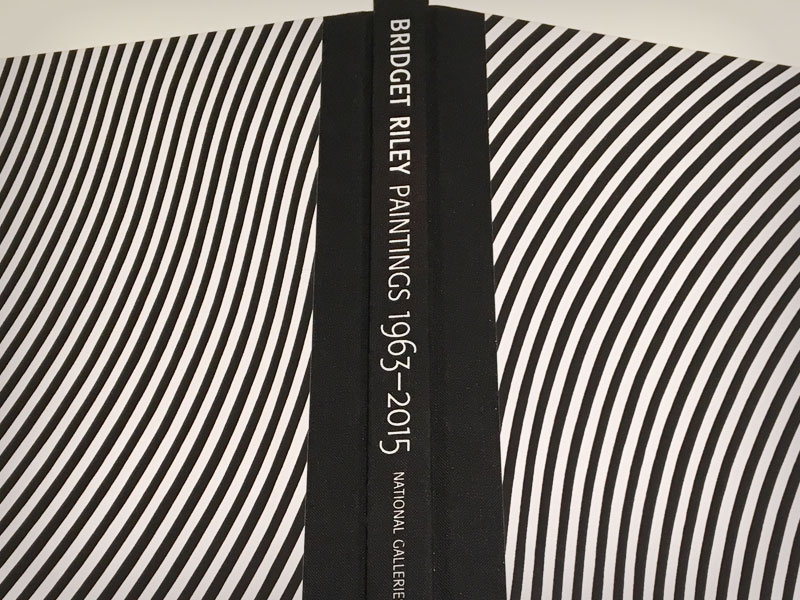
So to my inspiration for this set. Let me introduce Bridget Riley. I only discovered her this year on a visit to the Scottish Gallery of Modern Art in Edinburgh - such stunning paintings! I knew as soon as I walked into the exhibition I had to make some of them move!
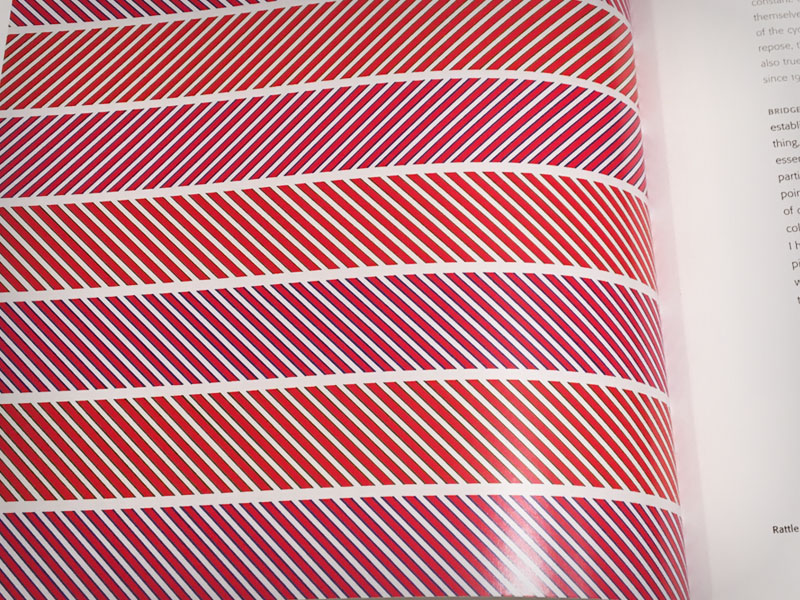
So let’s start with 'Rattle'. It’s a simple one where we can just create some sections and style them with background gradients and then make them shrink and grow horizontally to the sound.
<div id="screen">
  <section></section>
  <section></section>
  <section></sect<on>
  <section></section>
  <section></section>
  <section></section>
  <section></section>
  <section></section>
</div>
#screen {
  position: relative; padding:1vh;
  width: 100vw; height: 100vh;
  box-sizing: border-box;
  background: black;
}
#screen section {
  height:8vh; margin: 3vh;
  background-color: mediumorchid;
  background-image: media/ linear-gradient(45deg, mediumorchid 9%, seagreen 9%, seagreen 16%, white 16%, white 34%, seagreen 34%, seagreen 41%, mediumorchid 41%, mediumorchid 59%, seagreen 59%, seagreen 66%, white 66%, white 84%, seagreen 84%, seagreen 91%, mediumorchid 91% );
  background-size: 2vh 2vh;
}
#screen section:nth-of-type(2n) {
  background-image: media/ linear-gradient(135deg, indianred 9%, seagreen 9%, seagreen 16%, white 16%, white 34%, seagreen 34%, seagreen 41%, indianred 41%, indianred 59%, seagreen 59%, seagreen 66%, white 66%, white 84%, seagreen 84%, seagreen 91%, indianred 91% );
}
Now we have 8 sections, all stretched along our screen div. Let’s loop over them and change their width depending on the volume of a frequency.
You may have noticed already we have 256 frequencies and only 8 sections. There’s a couple of ways we can play this, (sorry), we can either use the first 8 items in the frequency array for the first section and the next 8 for the next and so on, or we can jump 32 items and get a range of 8 frequencies from our spectrum. The choice is yours really - now it’s just about having fun and playing with the maths. Sometimes it also depends on what music you’re playing.
For simplicity, I’m going to jump.
function animateStuff() {
  requestAnimationFrame(animateStuff);
  analyserNode.getByteFrequencyData(frequencyData);

  for (let i=0; i<totalEls; i++) {
    var freqVol = frequencyData[i*32]/2;
    allRepeatedEls[i].style.width = freqVol+'vw';
  }

}
The volume values received back from the analyser node range from 0-255, so I’m dividing by 2 to give rough value for the section to take up.
As the weeks go by we’ll find better, more smoother ways of dealing with the DOM, but for today; huzzah! We made some things move to the music - it plays pretty well to Warrant G and Nate Dog - Regulate, if you were wondering…